Needs Analysis Phase Report
Talking to potential users and identifying their needs
Throughout this phase, we collected information by two main methods. The first was that we sent out a google survey to get an overall sense of how open the majority of people would be to our idea and problem space. We also used results from the survey to help figure out how different technologies help or hurt people’s connection with nature. And the final goal of the survey was to recruit people to interview, which we did by asking respondents to input their email if they were willing to talk to us. We got 4 interviews through the survey.
Survey
The survey asked the following informational questions:
- Have you wanted to get out into nature and the outdoors more recently?
-
89% of people answered yes
- How interested are you in learning about your local natural environment?
-
Most people ranked above a 7 on the second question, which was answered on a scale from 1 to 10
- Would you be more motivated to get outdoors if you could learn more about your local natural environment while doing so?
-
We got a mix of answers for this question. Only 40% said yes, with the rest answering no or unsure.
- Would you be willing to use technology to connect more with nature?
-
This was a multi-select question. 9% of people said yes, 60% of people said it would depend on the technology, and 54% said no.
- What kinds of technologies do you use to help you interact with nature, and what technologies prevent you from interacting with nature? (eg. map apps, exercise tracking, photos)
-
We got a lot of interesting written responses from this question. Some common themes included that people used maps and photos to help them connect, but notifications from work/school and social media were harmful to their connection with nature
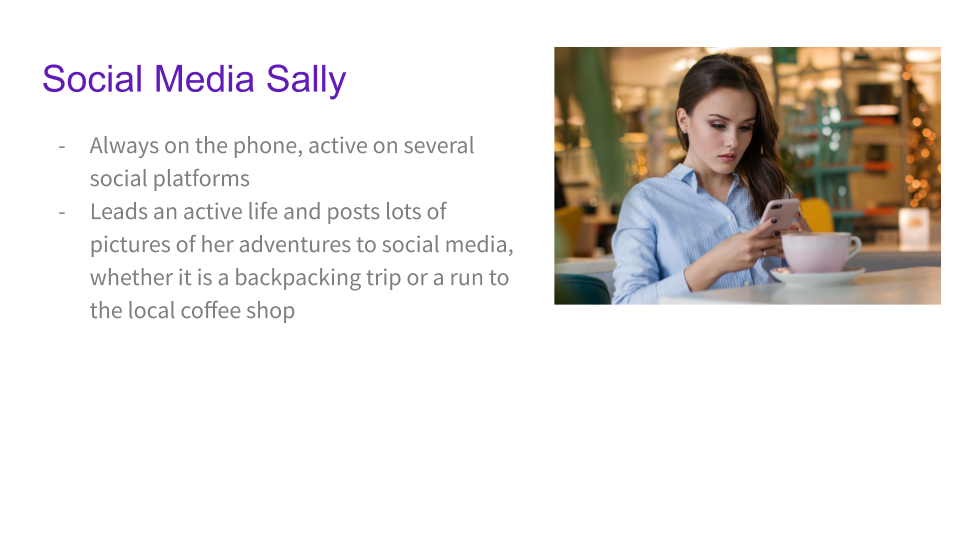
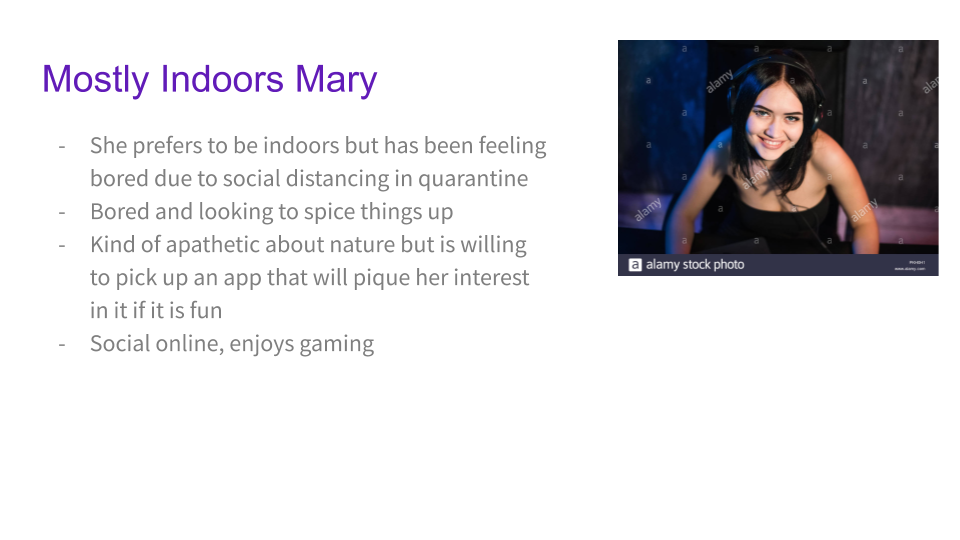
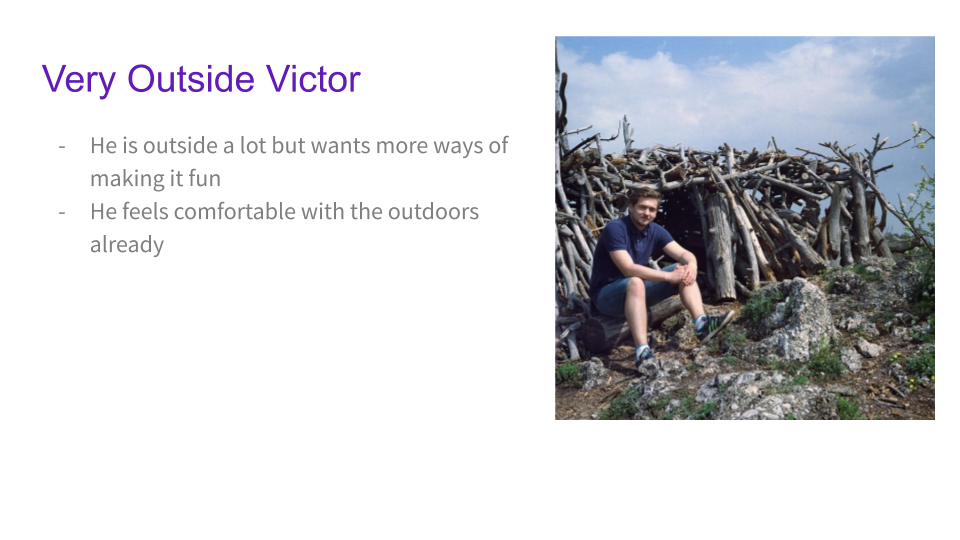
Proto-Personas
We got some useful information, especially from the long answer questions. We were able to use that information to make some proto-personas.
Interviews
We had 5 total interviews with both people from the survey, and family/friends. We asked a combination of more general questions, like asking someone to walk us through the experience of when they went outside recently, and we asked for specific feedback on our 4 ideas.
Journey Maps
We used information from some of our interviews to make journey maps for the process of how people go outside first without our app. Once we do more work on the app, we can use these to think about how the app will figure into these journey maps for specific people, as well as creating a more general journey map for using the app.
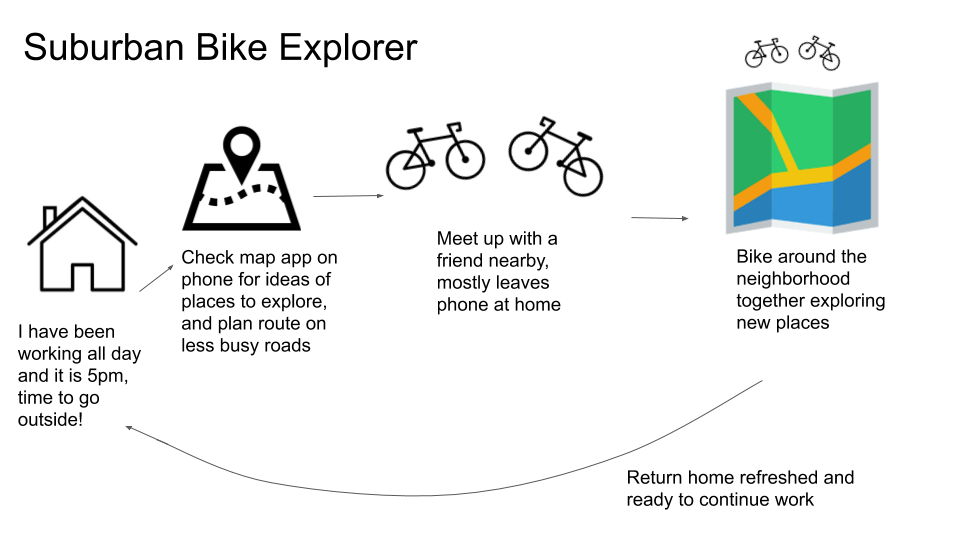 This journey map helped us understand how a user can use technology in the planning stage of their journey, but leave technology behind while going outside.
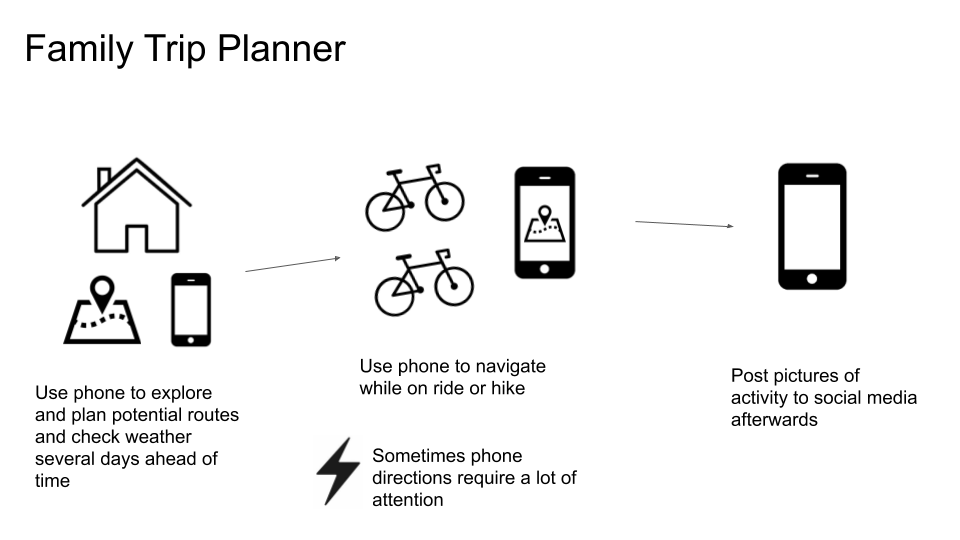 This journey map gave us an idea of what an experience of going outside looks like for somebody who plans out their trips, and uses technology throughout the process.
Other Artifacts
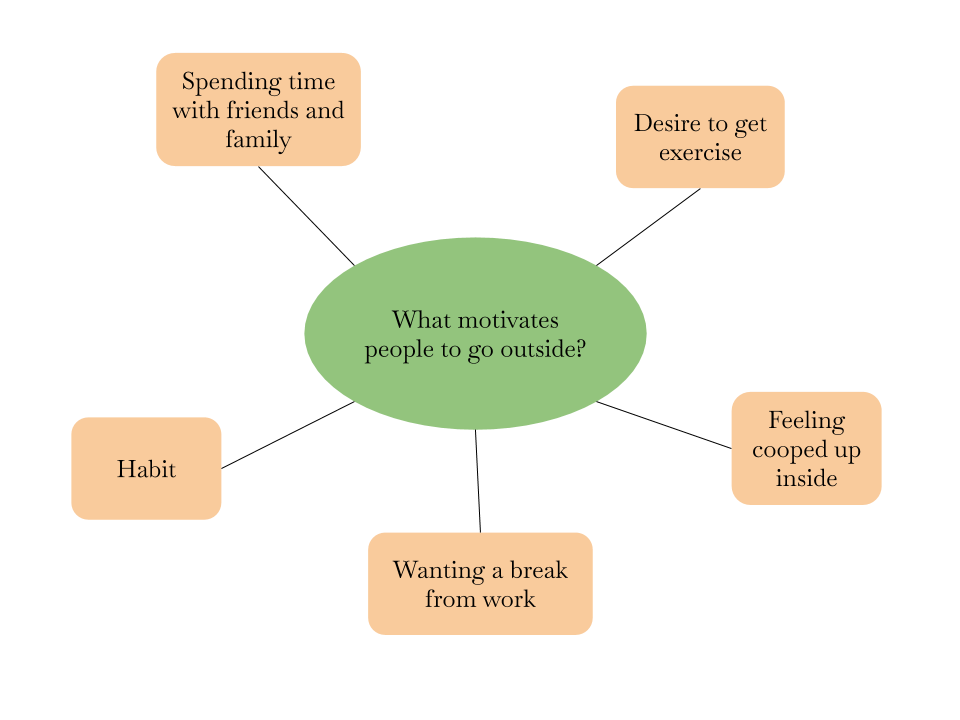
We also noticed that people had a lot of different reasons for going outside, so we made a map to organize and represent these reasons.
Affinity Diagrams
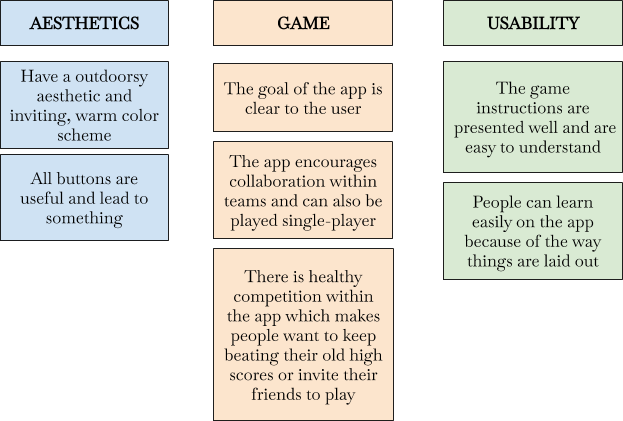
We made an Affinity Diagram to organize information about what charactaristics we determined our app should have based on user interviews.
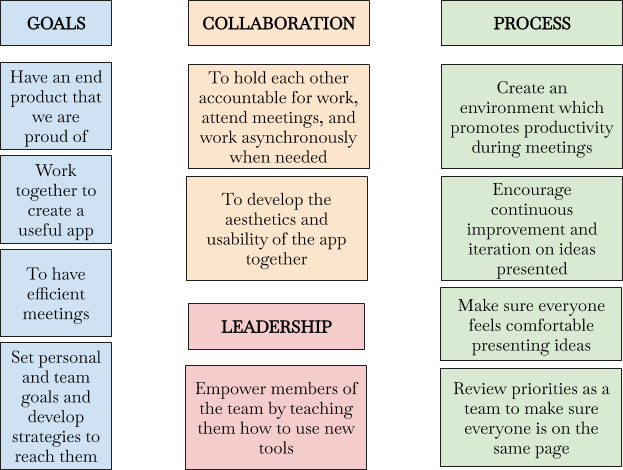
We also made another Affinity Diagram to represent what we as a team want out of the class UXD as a whole.